(Summary in Finnish: Aloitamme oppimispäiväkirjan.)
Starting today, this blog will measure anything!
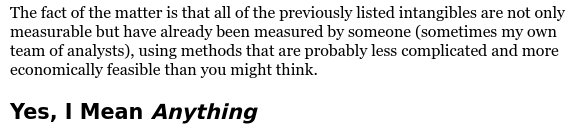
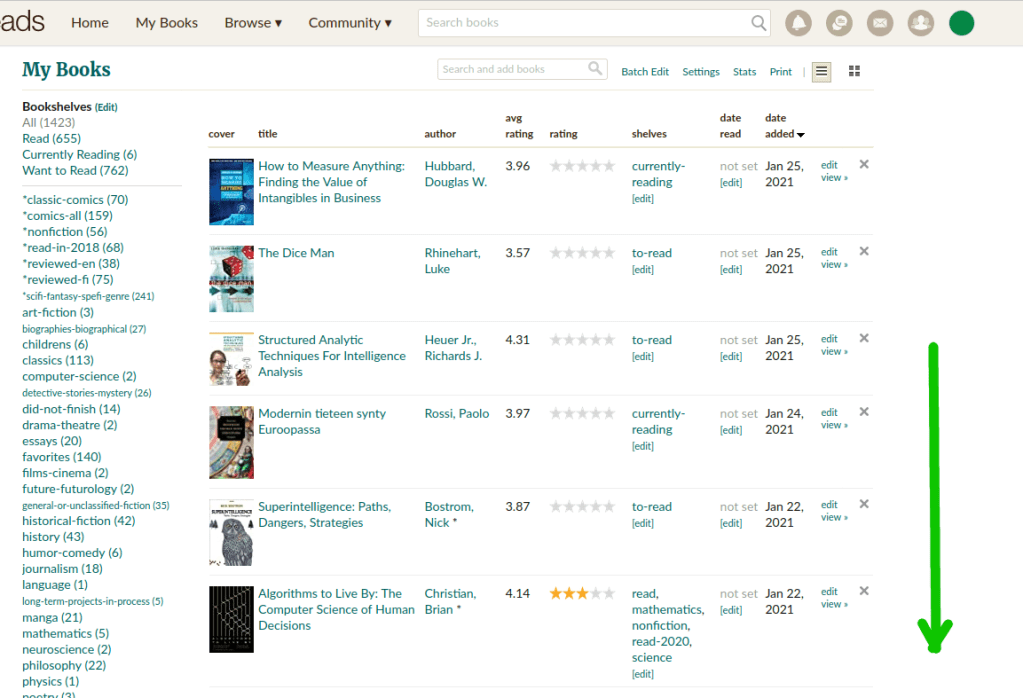
To give some background context to the uninitiated, some weeks ago together with some friends we formed a book club, with the intention to read and study a book by Doublas W. Hubbard with a (slightly overconfident) title, How to Measure Anything (GoodReads link). I was not the originator of the idea, but while joining, I made a threat: I would write a series of reflective “learning diary”-style posts as we go to bootstrap my blog. As I heard no objections, here we are.
As the first book club meeting (concerning chapters 1 and 2) is planned due tomorrow Sunday (2021-01-31), I think today is the time and place for writing up a “volume zero” post about my general impressions and plans, before delving into its contents too deeply.
What is it?
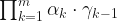
Given the book tells a lot about measuring things, I start with looking at some measurements about the book. (More or less, the following summarizes my initial impressions, as the book was not suggested by me, but a friend; I personally had not heard about it beforehand.) It has 433 pages, a respectable length but not too long. On GoodReads, it enjoys generally favorable ratings (average rating 3.96 on five star scale, with 2 283 ratings and 181 written reviews). The ratings distribution looks more encouraging than the mere central tendency reported by the mean would imply:
What about the qualitative commentary?
The reviews by GR users suggest (i) that they felt the book was useful, but also (ii) that it should not be too technical / advanced for anyone already familiar with some statistics. I believe I will be familiar with the technical content (though refresher never hurts, especially as I never took a formal course in decision analysis / theory, despite always planning to do so). Judging by the cover blurb, book looks quite exciting, and I am quite eager to read and talk about its advice concerning how to apply concepts from decision theory and statistics into practical context.
Googling around reveals a couple of webpages for the book (https://www.howtomeasureanything.com/) and also the website of the author (https://hubbardresearch.com/; it appears that he runs a consulting service).
Most importantly, I also found this extensive-looking review on the forum LessWrong, which actually discusses the basic ideas of the book in detail. If you think this blog series of mine is too slow, maybe go and read it (skimming it reinforces my interpretation that I will find the book fun; but I didn’t actually read it, as the point of this learning diary exercise is to do the hard job of thinking that goes into summarizing a book by myself).
So, what’s in it?
Very briefly stated (at this point, I have started cheating forgo the rule of “generic impressions only”, and have read the introduction and Ch. 1), Hubbard’s central claim is: Anything that can observed, can also be measured. Yes, anything. Yes, it is a near direct quote.
As the quote reveals, “anything” especially applies to quantities often considered difficult to measure or outright intangible. Hubbard names several examples, such as “the value of information”, “management effectiveness”, “the risk of failure of an IT project”, “public health impact of a new government environmental policy”, “public image”, and such, and proceeds to point out that several of such constructs are actually quite often measured by specialists for a great effect! (I assume the details will come up in later parts of the book.) The book aims provide a generic tutorial and resources how to go about measuring theese intangible quantities for great enhanced value and insight in matters of business, government and other similar fields.
Some other picks: Hubbard has given a special name to his system, calling it “Applied Information Economics” (which I suppose I will discuss in more detail in the next installment). He also professes to subscribe to subjective Bayesian view of probability as his philosophical view.
(For those without background in this topic, the list of questions we will hopefully answer in future installments as we progress with the book include: What is Bayesian stand on philosophy of probability? How probability can be subjective? If you want sources, Wikipedia has an okay but quite dry explanation, here, and the introduction of this internet book by Albert and Hu looks alright, too.)
Expectations?
I have two main lines of thought. First, the positive one: If the book lives up to its billing, I feel it is going to be extremely useful. With practically every topic I have studies in school / university (whether it was Java programming, or theory about real analysis or linear maps or combinatorics, or whatever), it always turned out that actually doing and applying what you thought you already had learned into novel, practical context, by yourself, was always surprisingly difficult (but often also surprisingly rewarding), no matter if it was a proof exercise or a programming project or a data analysis task. I am quite sure this is an universal observation. As far as learning experiences go, doing things is the best way to learn, except for teaching others to do something, which is even better (because one has both do and explain?)
The good stuff here is, the Hubbard claims that his book is all about applications of mathematical ways of gathering and using data to make decisions, often about unconventional problems! I did spend years in uni and then again two years as a grad student, sometimes doing but also quite heavily studying; and when I did apply statistics, it usually was in established contexts where there is an established way to do an analysis (and more or less spend first quite a deal of time to understand why the established way is as it is, and then proceeding to repeat it). Trying to measure something that is not obviously measurable should be exactly the practice I need today.
What about the other line of thought? I grant that the skeptical, academically trained part in me has also some reservations. The tone, as far as I have read, is a bit too much self-congratulatory and a bit pretentious. He invented “Applied Information Economics”, googling which brings up mostly his own books, webpages and other writing? Oh well. However, I suspect (and the author certainly alludes so in the intro) that at worst he is merely packaging old and known ideas in a new shiny wrapping that makes it enticing to management directors. While I do like better a textbook that shows, should I say, more outward humility, Measuring Anything can be okay / very useful / extremely useful if the repackaging is done well.
(By the way, a great recommendation if you like an entry-intermediate level statistics textbook with wordy explanations with a more academic than “business management” wrapping is Richard McElreath’s Statistical Rethinking https://xcelab.net/rm/statistical-rethinking/.)
Going forward!
The next post in this series will cover the contents of Chapter 1 and 2 in more detail. (I have already outlines quite much the Chapter 1 has to say about itself, so more about Chapter 2 then).
As a “homework” of sorts, Hubbard also suggests the reader to choose a couple of example questions they are interested in and would think are difficult or impossible to measure in quantitative, numerical way. So I will do! I anticipate reading the book will prove me false!
My intention is to choose some both easy and maybe bit more difficult things to measure, keeping an eye for things I am genuinely interested in to keep myself motivated.
- How much time I spend procrastinating and how much of that I could practically redirect to more productive purposes? (The reservation in italic, is supposed to convey I want to do it without my quality of life and relationships significantly dropping because of me turning into a depressed workaholic.) (Answering this, I assume, will be quite possible.)
- I also much confess I am interested in politics and society (maybe too much for my good). One question that often pops up in discussions I have, is do budget cuts in government-funded public services end up saving money or causing more costs because of second-order effects? To pick a specific example, I choose (a) public library services and (b) social services. (I suspect this is going to be much more difficult, but ambition won’t hurt here?)
- This one relates to my academic interests. Would preregistering explorative statistical analyses in science help or hurt science, and how much?
I think three questions is a right amount (won’t be too boring). I emphasize that the questions 2 and 3 appear quite difficult to me, but the author promised I can measure anything. :–)
edit 2021-01-31. Some paragraphs had text from unfinished draft version that slipped through.
edit 2021-02-24. Links to other parts in the series: vol. 1. vol. 2.)

 Don’t worry about if the math does not make sense, it is supposed not to.